Ecological Niche Modeling
Piper nigrum is naturally distributed in India in the Western Ghats biodiversity hotspot and other parts of Asia. This distribution is a result of the realized ecological niche of the plant, which refers to the places where the plant is actually found and thrives. However, there are many other places where this crop could grow, which would be its fundamental ecological niche.
The ecological niche modeling approach has been used to predict the fundamental and potential geographic distribution of black pepper before. HAO et al. (2012) predicted the potential geographic distribution of Piper nigrum using the maximum entropy algorithm. The analysis predicted these areas successfully and was found useful in applications such as crop introduction and conservation. Sen et al. 2016 used this same methodology and algorithm to study the impact of climate change on black pepper in Western Ghats, India. Similar approaches have been used for the modeling of the ecological niche of the pest Spodoptera frugiperda and its distribution in future scenarios (Zacarias, 2020).
Methodology
In order to model the ecological niche of P. nigrum and Spodoptera frugiperda the 19 bioclimatic variables of WorldClim version 2.1 were used at a resolution of 2.5 minutes. The occurrences data were obtained from the Global Biodiversity Information Facility (GBIF) database. The ecological niche modeling was made using the Maximun Entropy (Maxent) algorithm described by Phillips et al. 2006; it is a machine learning method well suited for prediction of the distribution of species with presence-only data. The model used a 30% presence data points as test dataset and the resting data points as the training dataset, bootstrap was performed with 1000 iterations. The resulting model was projected on future bioclimatic variables under different scenarios, the scenarios ssp126, ssp245, ssp370 and ssp585 for the periods 2021-2040, 2041-2060, 2061-2080 and 2081-2100 for each scenario, these were obtained from the Australian Community Climate and Earth System Simulator Coupled Model 2 (ACCESS-CM2).
Results
Spodoptera frugiperda
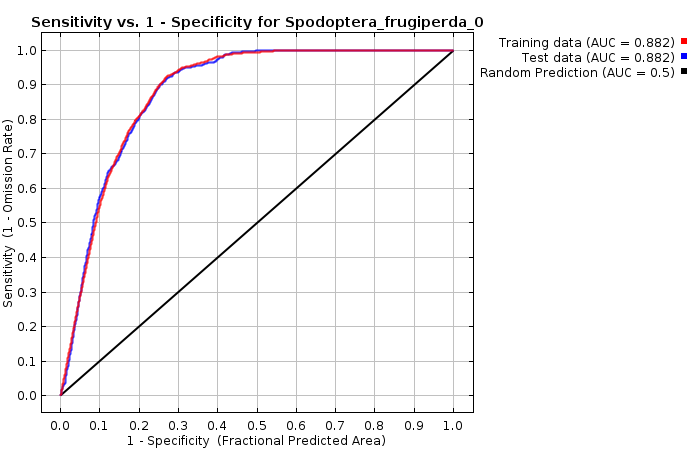
The next plot shows the receiver operating curve (ROC) for training and test data, along with the area under the curve (AUC). In this case the AUC is bigger than 0.85 for both training and test datasets, indicating a good performance of the model.
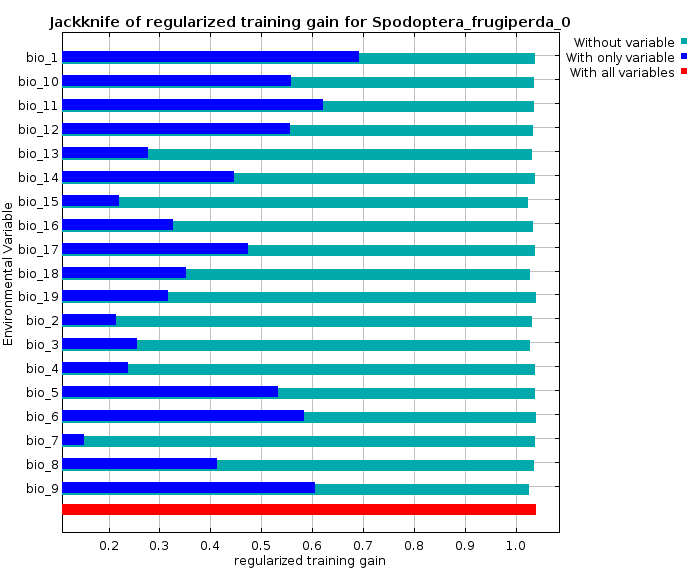
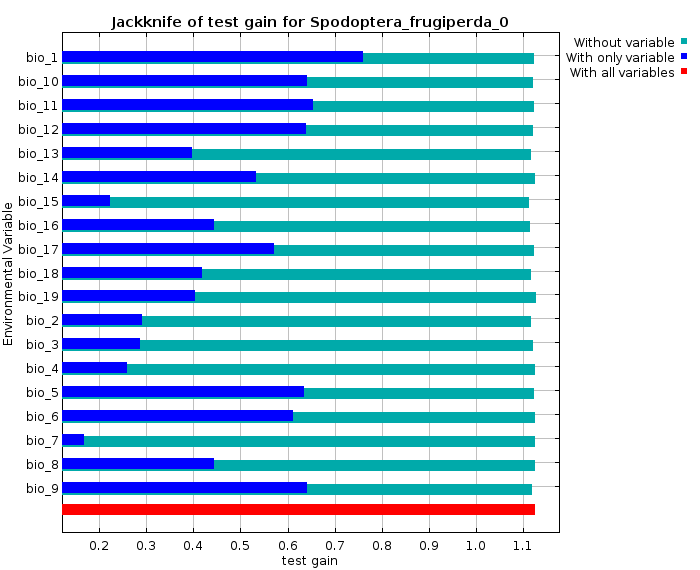
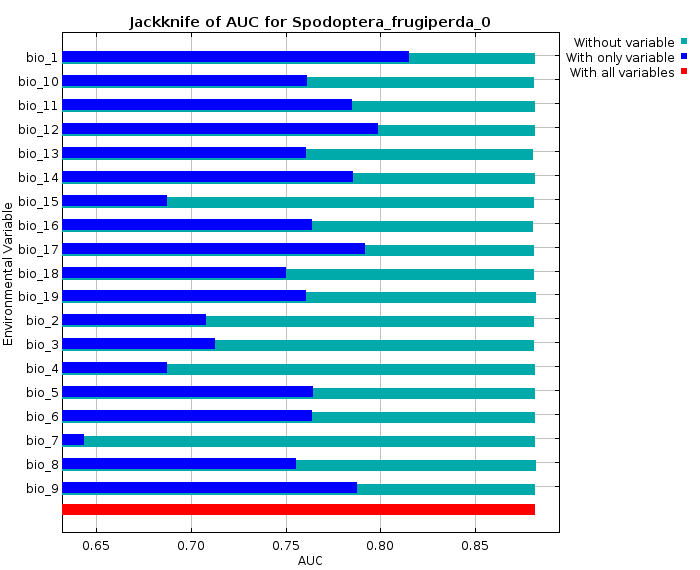
In order to know which variables are the most important when predicting the ecological niche of the fall armyworm, a jackknife analysis was performed. For this analysis, a model excluding every variable at once and also a model using only that variable was created and evaluated using training gain, test gain, and AUC.
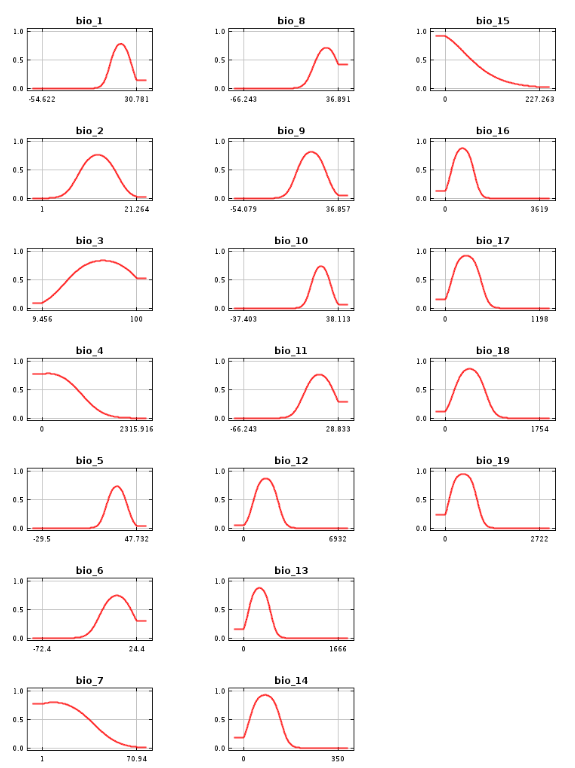
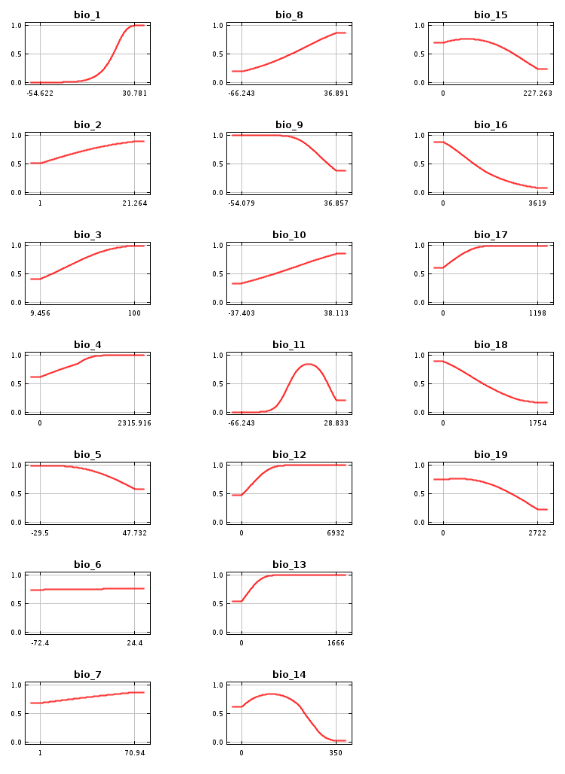
In the next figures, we can see that the most important bioclimatic variables to predict the distribution of S. frugiperda are bioclimatic variables 1 and 9 consistently on the three plots; these variables are Annual Mean Temperature and Mean Temperature of Driest Quarter. Other variables were important only when looking at the test, training, or AUC, like bioclimatic variables 6, 11, 12, and 17.
In the next plots, the response of the fall armyworm to the different bioclimatic variables is shown, whether it is only considering the bioclimatic variable independently or as part of the ecological niche model.
Response to Bioclimatic Variables Individually
Response to Bioclimatic Variables as Part of the Model
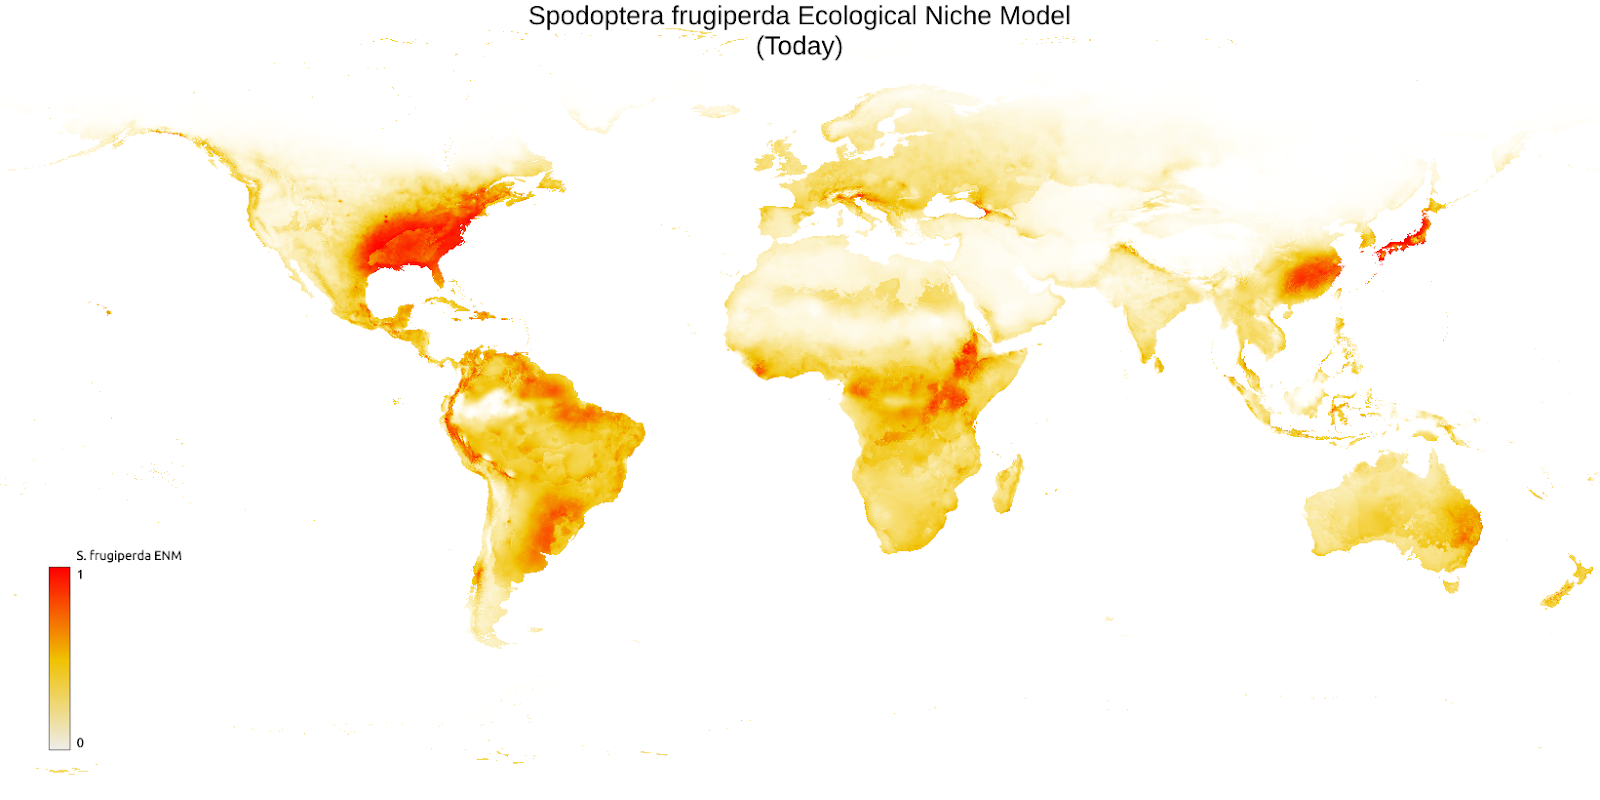
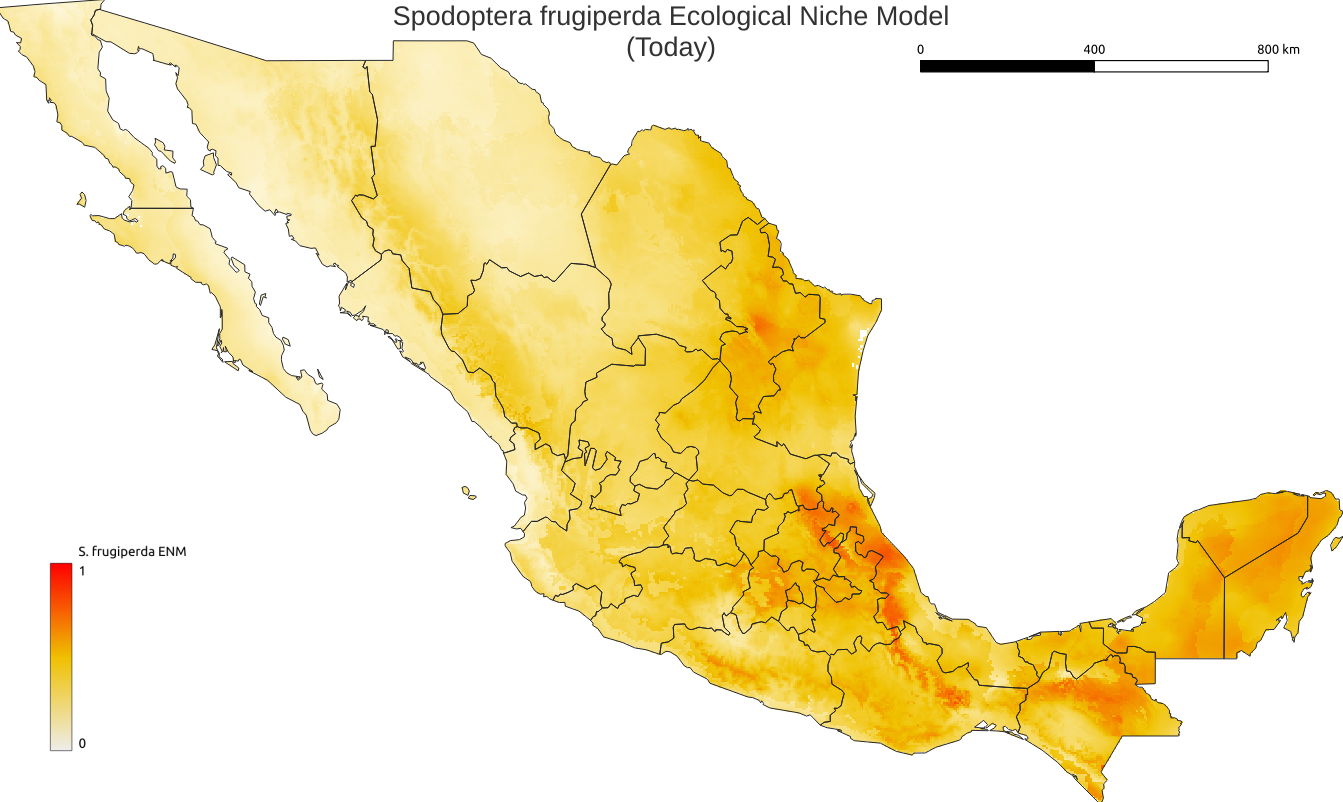
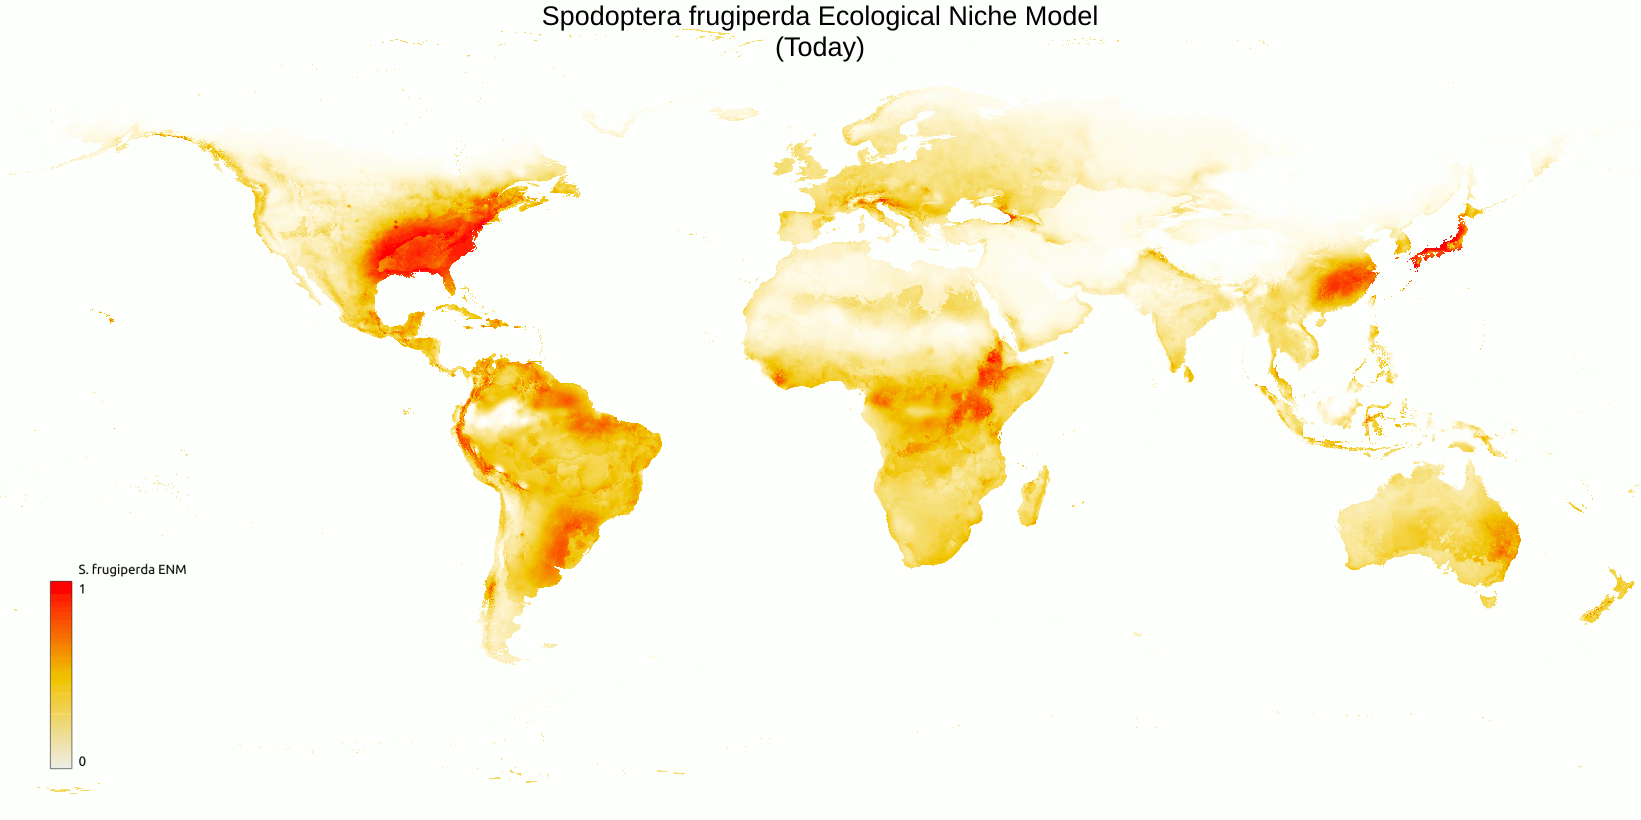
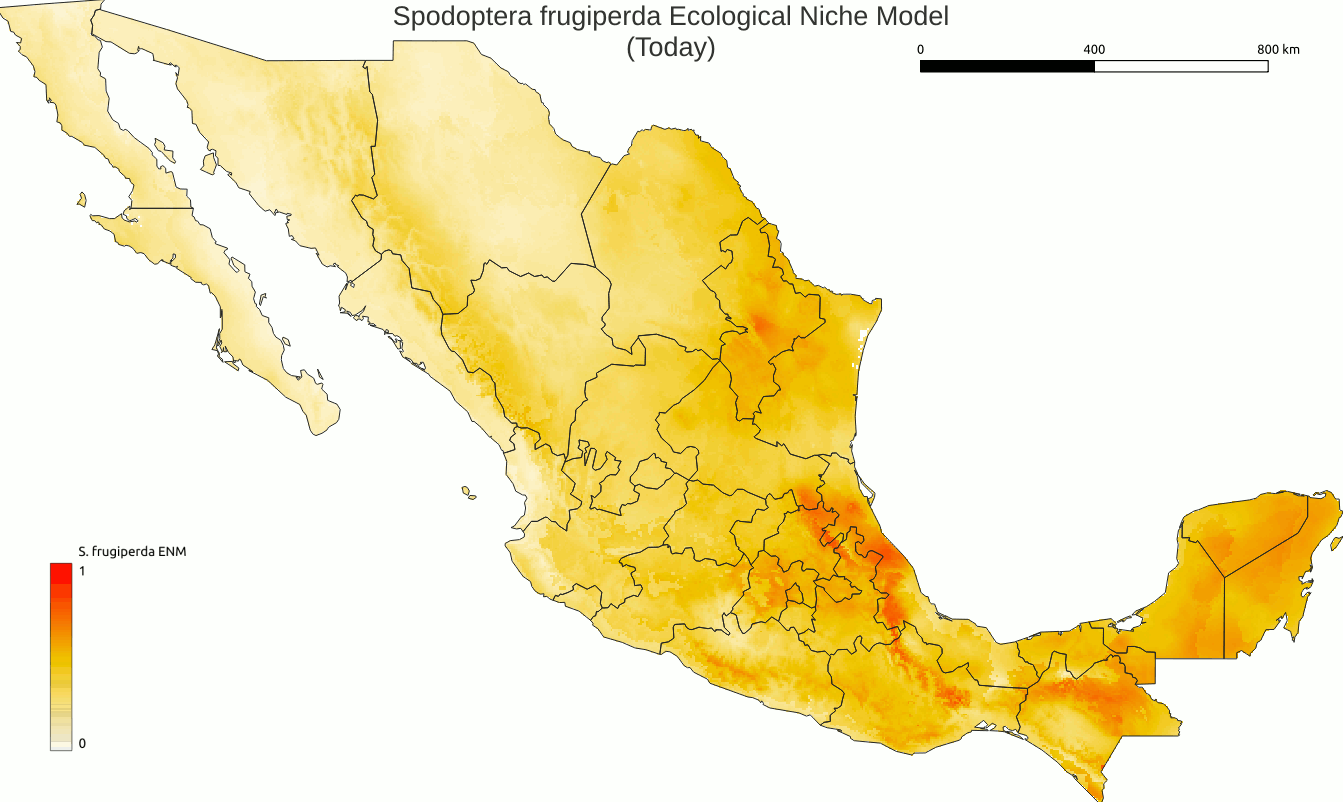
The modeled potential ecological niche was projected on historical bioclimatic variables from WorldClim version 2.1. The figures below show the current and future projected distribution for both the world and Mexico.
In the same way, the model was projected on future scenarios for the ssp126, ssp245, ssp370, and ssp585 on different time intervals in the future.
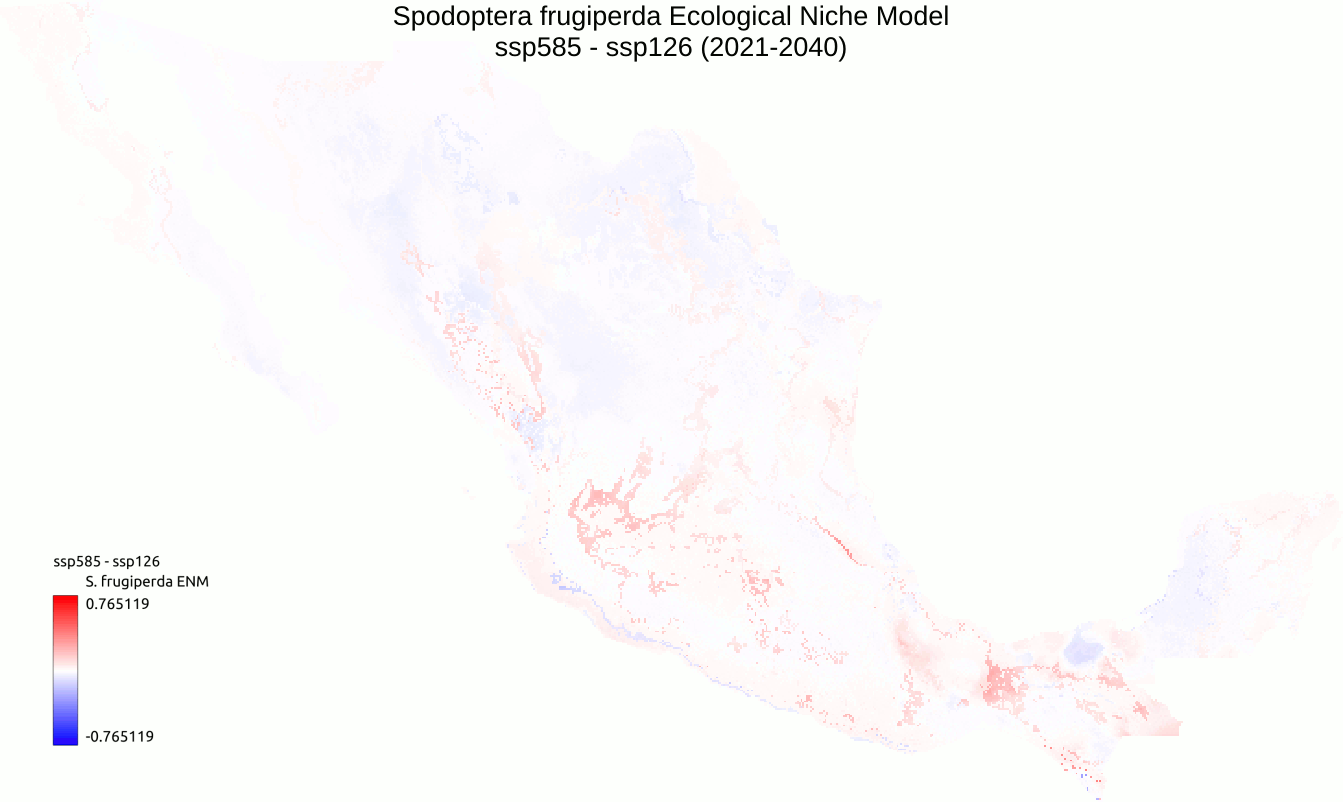
The next figures represent the changes in the potential niche of Spodoptera frugiperda under the most conservative and aligned with the SDGs scenario (ssp126) and the worst case scenario regarding climate change (ssp585) for the world and Mexico.

In order to see the impact of climate change, another layout view was created in which we subtract the niche suitability for the fall armyworm under the ssp126 scenario from the ssp585 scenario.
In this case, the resulting positive values mean higher habitat suitability, and negative values mean lower suitability under the ssp585 scenario.
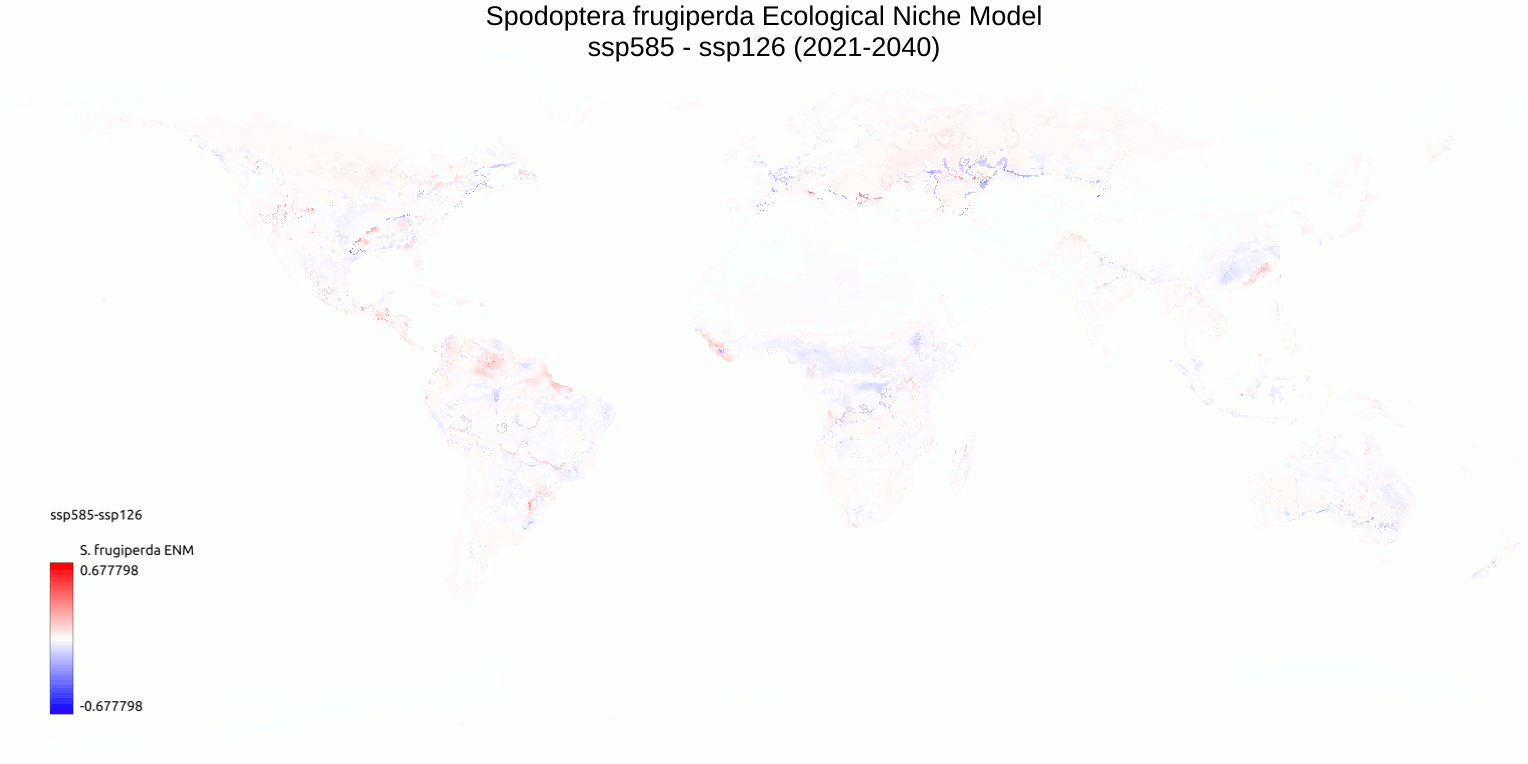
With these results, we can see that there will be a change in the potential distribution of the fall armyworm in all future modeled scenarios, but most importantly in the biggest corn-producing regions. The USA is the biggest producer, and also one of the countries in which the ecological niche would be most clearly affected by climate change in the future. This is an important point since the higher habitat suitability could diminish the crop yield, potentially reducing both the production and supply of this valuable crop.
This is a strong indicator that effective measures need to be taken to prevent significant changes in the structure of the market dynamics for this important crop. Actions could focus not only on the prevention of climate change but also on controlling this significant agricultural pest.
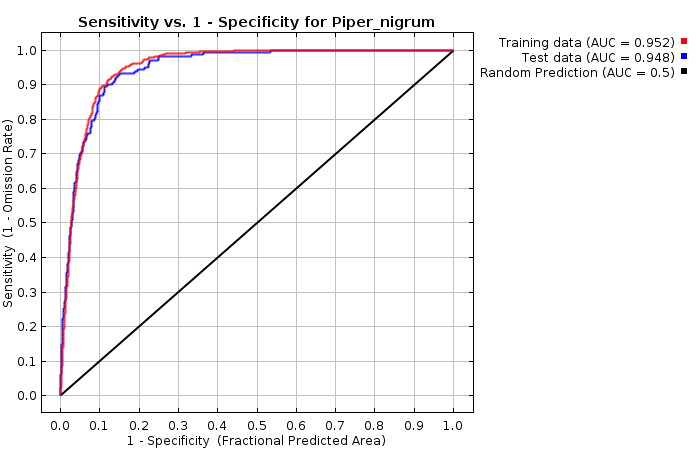
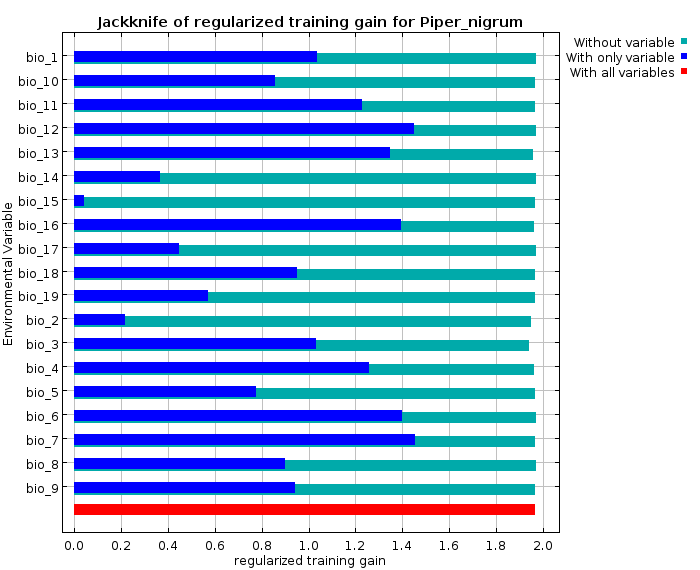
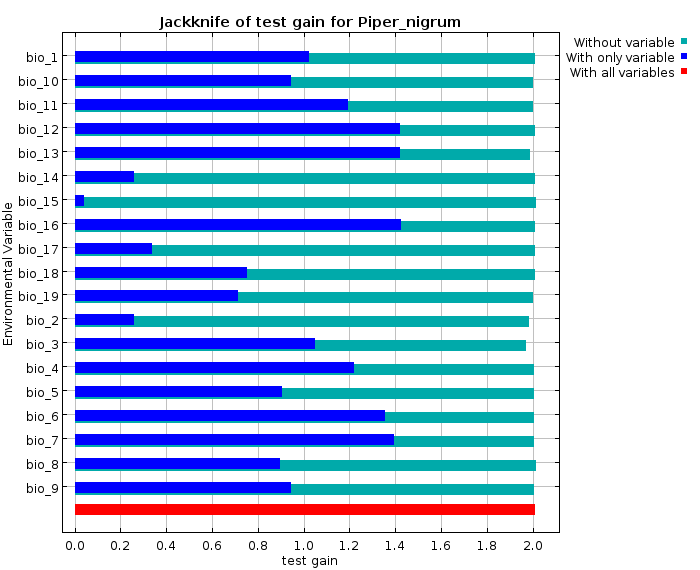
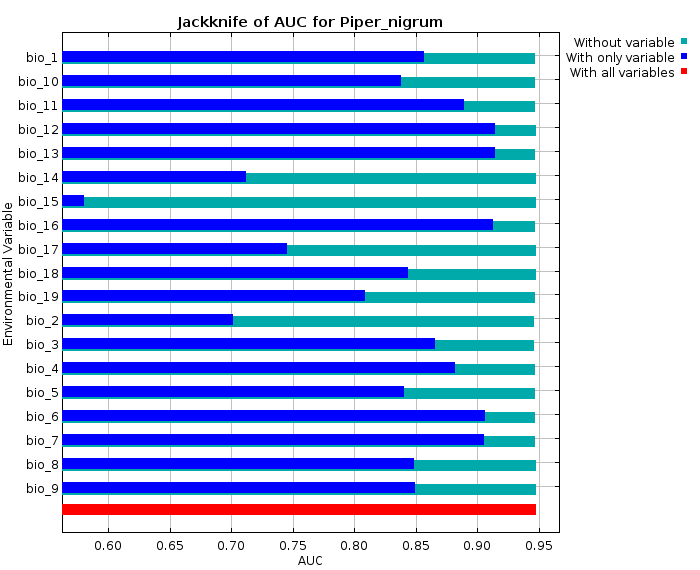
Piper nigrum
The next plot shows the receiver operating curve (ROC) for training and test data, along with the area under the curve (AUC). In this case, the AUC is bigger than 0.9 for both training and test datasets, indicating the high performance of the model.
In order to know which variables are the most important when predicting the ecological niche of black pepper, a jackknife analysis was performed. For this analysis, a model excluding every variable at once and also a model using only that variable was created and evaluated using training gain, test gain, and AUC.
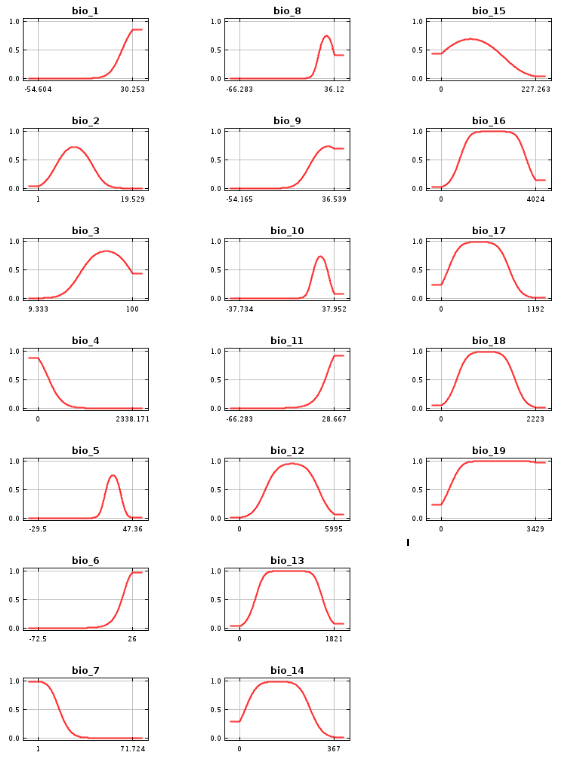
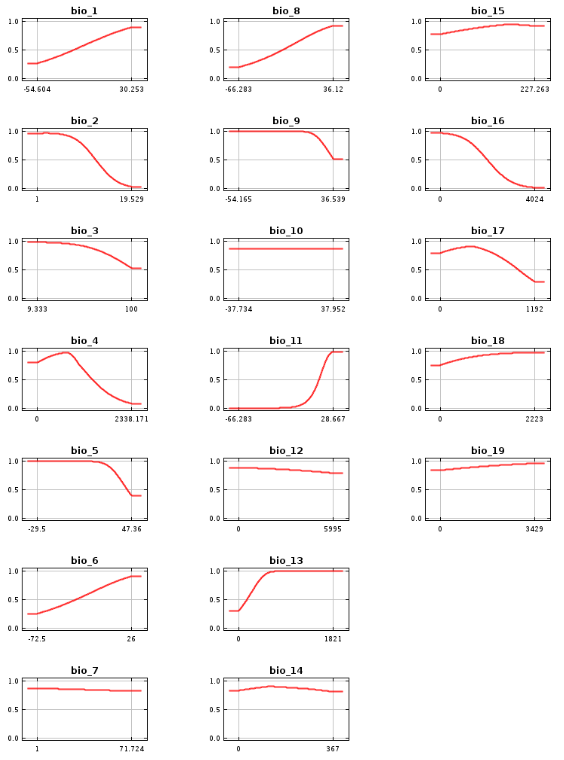
In the next figures, we can see that the most important bioclimatic variables to predict the distribution of P. nigrum are bioclimatic variables 6, 7, 12, 13, and 16 consistently on the three plots. These results are consistent with HAO et al. 2012, who found the same five variables as the most informative ones when predicting the potential niche in Asia for black pepper.
In the next plots, the response of black pepper to the different bioclimatic variables is shown, whether it is only considering the bioclimatic variable independently or as part of the ecological niche model.
Response to Bioclimatic Variables Individually
Response to Bioclimatic Variables as Part of the Ecological Niche Model
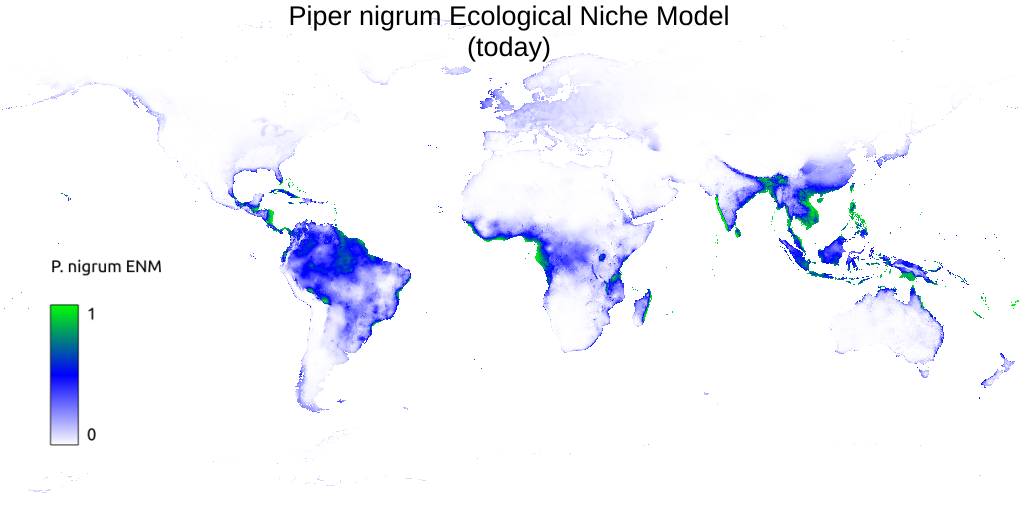
The modeled potential ecological niche was projected on historic bioclimatic variables obtained from WorldClim version 2.1 and shown in the next figures for its current worldwide distribution and its distribution in Mexico.
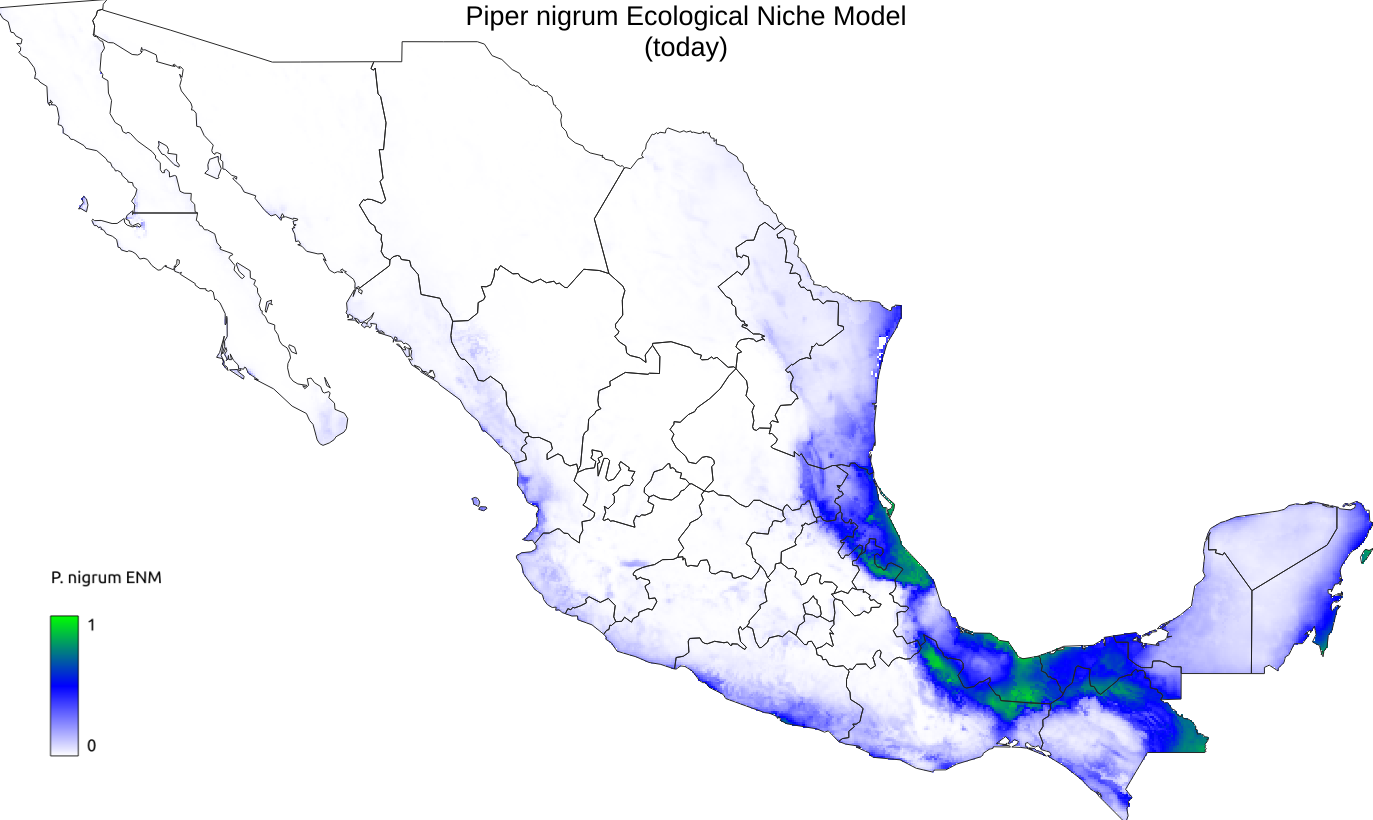
In this figure, we can see that the main region where the ecological niche is projected is in the southeast of the country, mainly in the states of Chiapas, Tabasco, Veracruz, and Oaxaca; which is consistent with the fact that these are the states that currently present significant production of black pepper.
The states of interest (Michoacán, Jalisco, and Sinaloa) do not provide an appropriate environment for the growth of this crop, so the production of piperine and related piperamides directly from the cultivation of P. nigrum in this region is not suitable.
References
- Fielding, A. H. and Bell, J. F. (1997). A review of methods for the assessment of prediction errors in conservation presence/absence models. Environmental conservation, 24(1):38–49.
- HAO, C.-y., et al. (2012). Modeling the potential geographic distribution of black pepper (Piper nigrum) in Asia using GIS tools. Journal of Integrative Agriculture, 11(4):593–599.
- Lane, M. A. and Edwards, J. L. (2007). The global biodiversity information facility (gbif). Systematics Association special volume, 73:1.
- Phillips, S. J., et al. (2006). Maximum entropy modeling of species geographic distributions. Ecological modelling, 190(3-4):231–259.
- Sen, S., et al. (2016). Modeling the impact of climate change on wild piper nigrum in Western Ghats, India. Journal of plant research, 129(6):1033–1040.
- Sillero, N. (2011). What does ecological modelling model? a proposed classification of ecological niche models based on their underlying methods. Ecological Modelling, 222(8):1343–1346.
- Soberon, J. and Peterson, A. T. (2005). Interpretation of models of fundamental ecological niches and species’ distributional areas.