Alternative Enzymes Selection
Methods
In order to perform a screening of proteins that could perform the same reaction as the selected enzymes for steps 5, 6, 9, 10, and 11, we performed a search using different approaches in different databases. We searched for proteins with the same EC number for classification of enzymes as the selected ones in the UniProt and Brenda databases. From the InterPro database, we got proteins with the corresponding Pfam Domains. From a homology-based approach, we performed a blastp against the NCBI database as well as a blast against the UniProt database.
From these strategies, we created a pool of candidate enzymes for the different steps of the proposed biosynthetic pathway. We obtained the peptidic sequence for all the candidates in order to perform the next steps for the selection of the next enzymes that will be probed for expected catalytic activity.
For enzymes 5 and 6, we performed a cluster analysis of the enzymes using the CD-HIT, a program used to reduce sequence redundancy and improve the performance of further analyses. We aligned the sequences using the muscle algorithm.
Another clustering strategy was used, based on the WGCNA R package. This is a correlation network analysis designed for studying gene coexpression, but the mathematical background was used in this case to analyze and cluster the universe of candidate enzymes. We defined the adjacency matrix as the sequence identity value between each two enzymes calculated by the seqidentity percent identity function from the bio3d R package.
ai,j = seqidentity(xi,xj)Where a is the adjacency value, seqidentity indicates the function for getting the sequence percentage identity between two proteins and xi and xj are the sequences in the i row and j position. This matrix is the size n x n, where n is the number of sequences. The distance matrix is defined as follows:
di,j = 1 - ai,jThe enzymes were then clustered by the UPGMA (unweighted pair group method with arithmetic mean) algorithm. The modules were formed by this methodology by using a constant-height cut strategy.
The top 20 proteins with the highest identity to the original enzyme were selected for the next steps. Additionally, the enzymes that were representatives of a CD-HIT cluster and had an annotation corresponding to the expected enzymatic activity were selected for the next steps.
E5
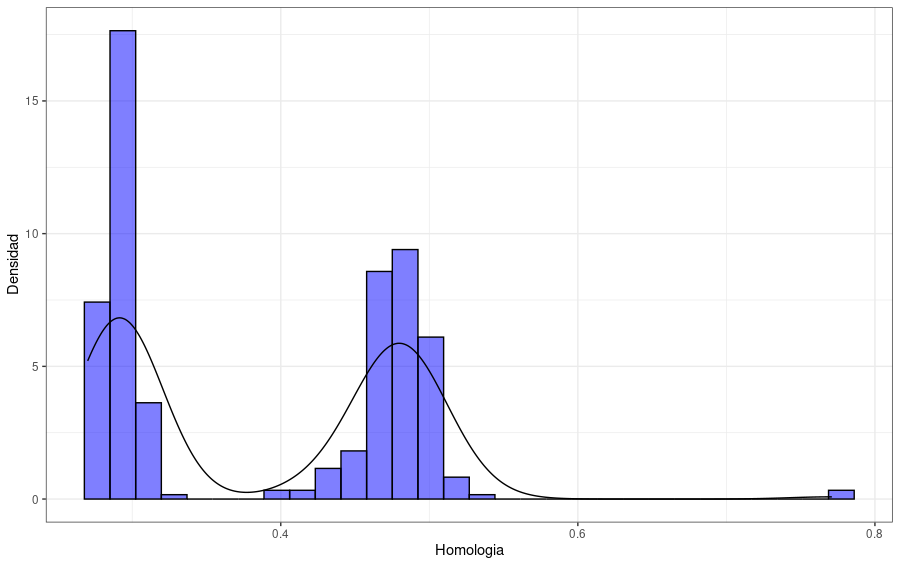
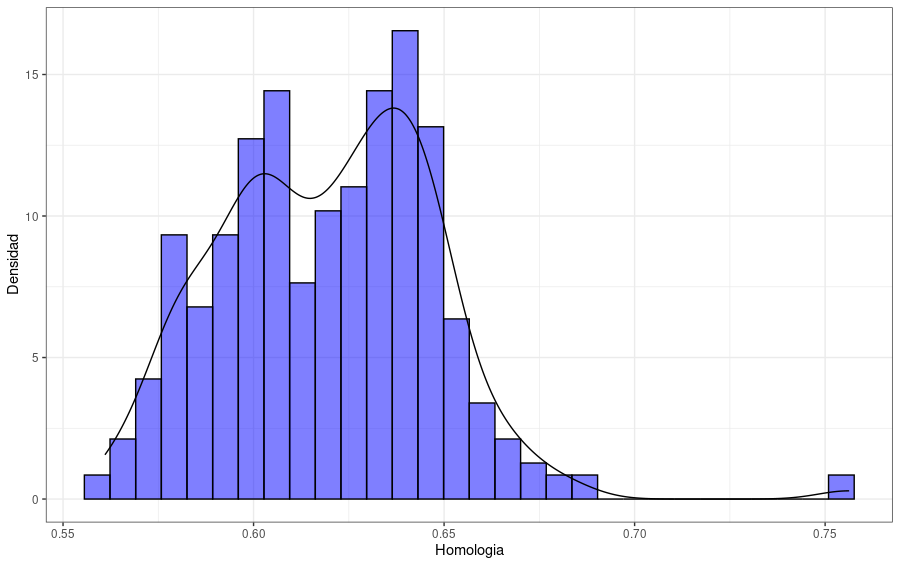
The next plot shows the distribution of the protein identity to the reference enzyme. We can observe a distribution with proteins with an identity value smaller than 0.4, another group of candidate proteins with identity values between 0.4 and 0.6, and only a few proteins with greater values.
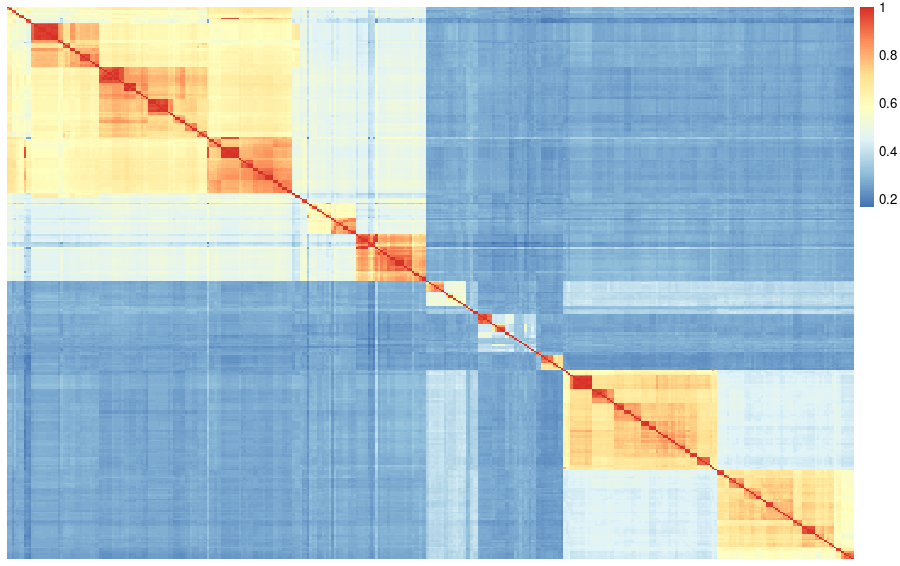
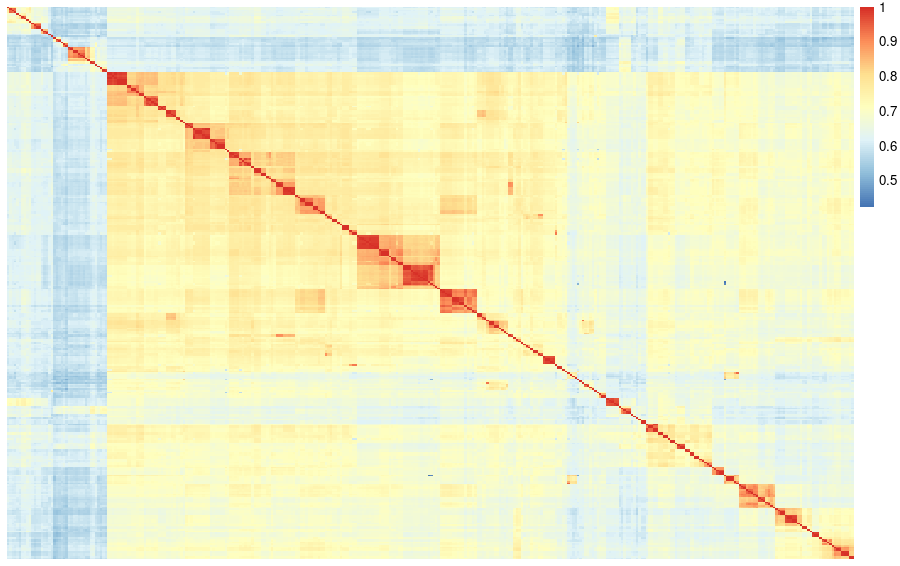
When visualizing the adjacency matrix with a heatmap, we can observe the formation of clusters of proteins that are more similar within the clusters than between clusters.
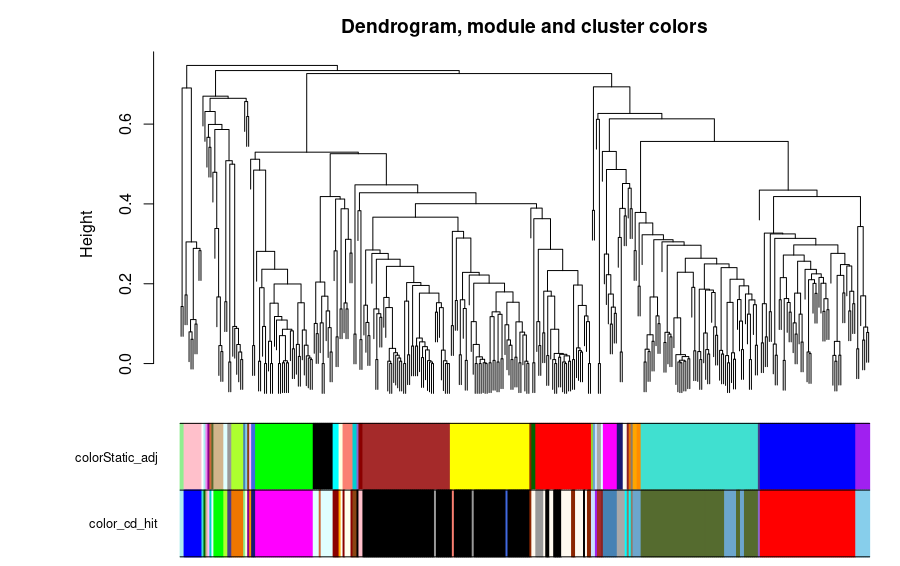
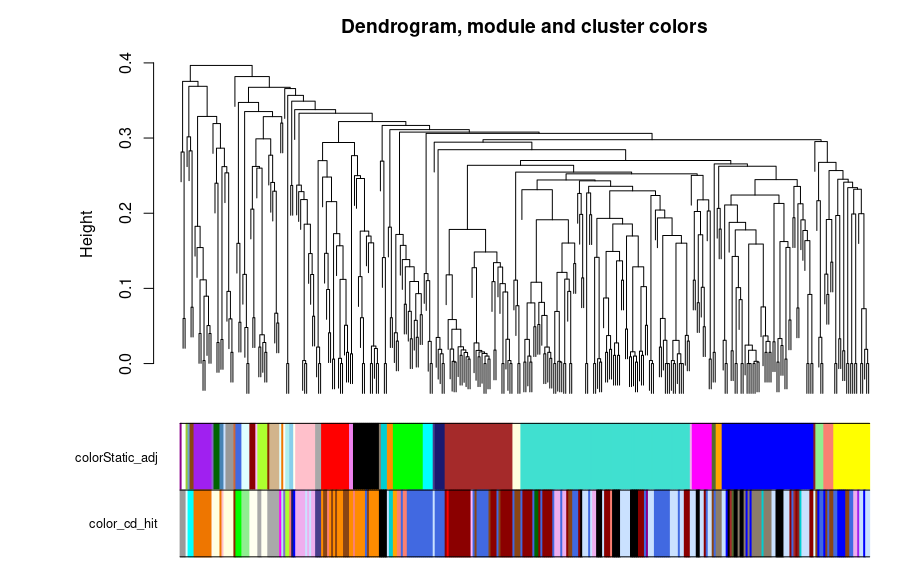
The clusters formed by the CD-HIT were created with a threshold value of 0.6 and a word size of 4, forming 44 clusters. In the case of the correlation network analysis, the threshold for the cut was 0.4. The comparison of the CD-HIT clusters against the correlation network (StaticAdj) modules is shown in the next figure.
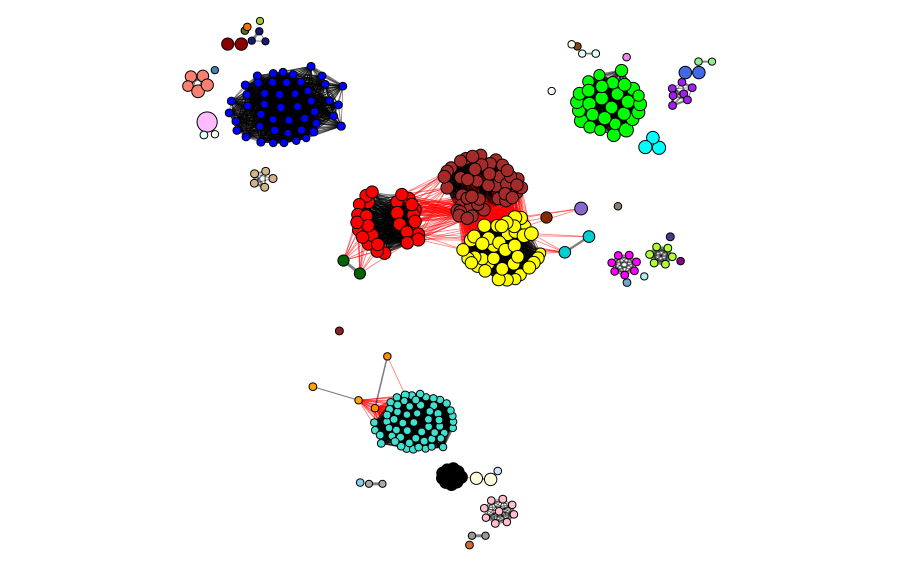
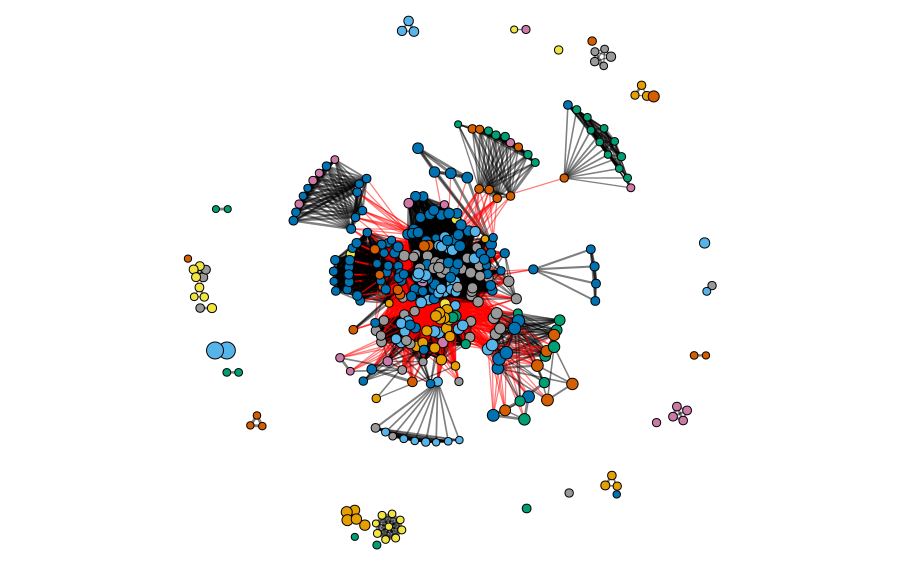
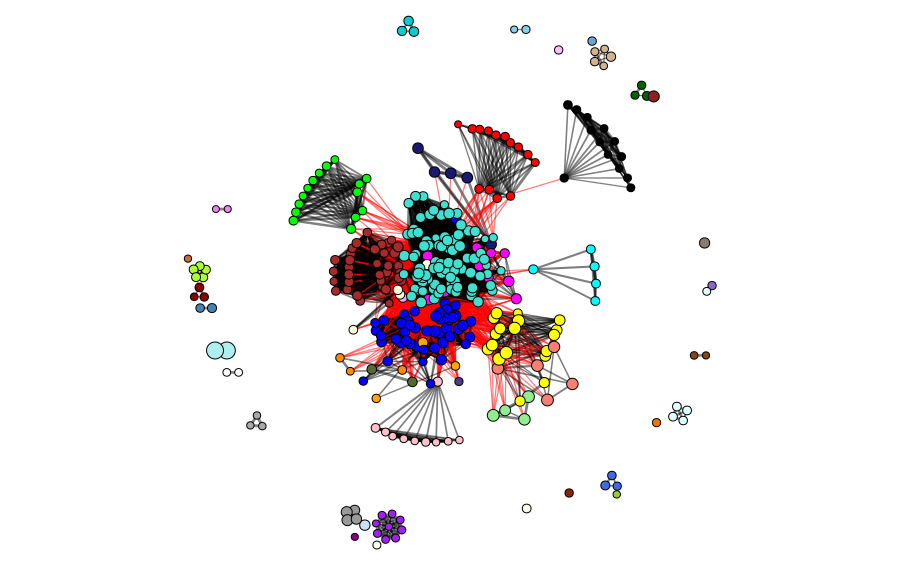
The clusters and modules can be visualized in the gene universe as a network, where the weight of the connections corresponds to the adjacency of each pair of proteins and the size of the node corresponds to the identity to the reference protein. In the next figures, we can observe the clusters and modules formed by the two methods in the protein universe represented as a network, where each color represents a different cluster or module.
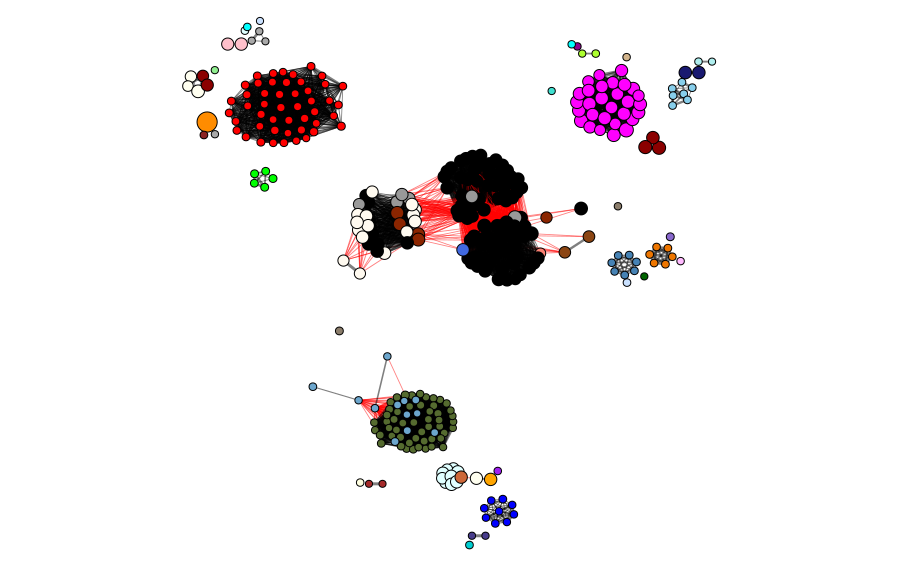
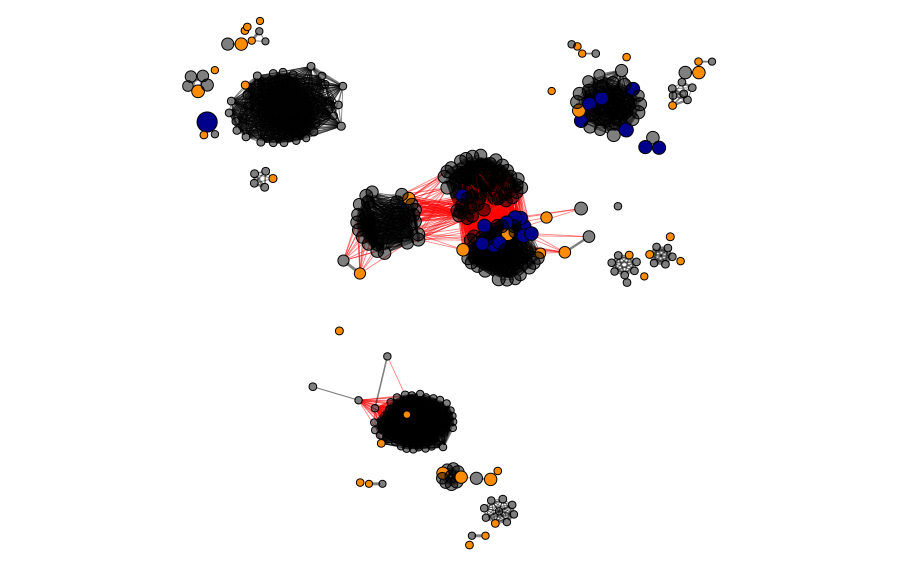
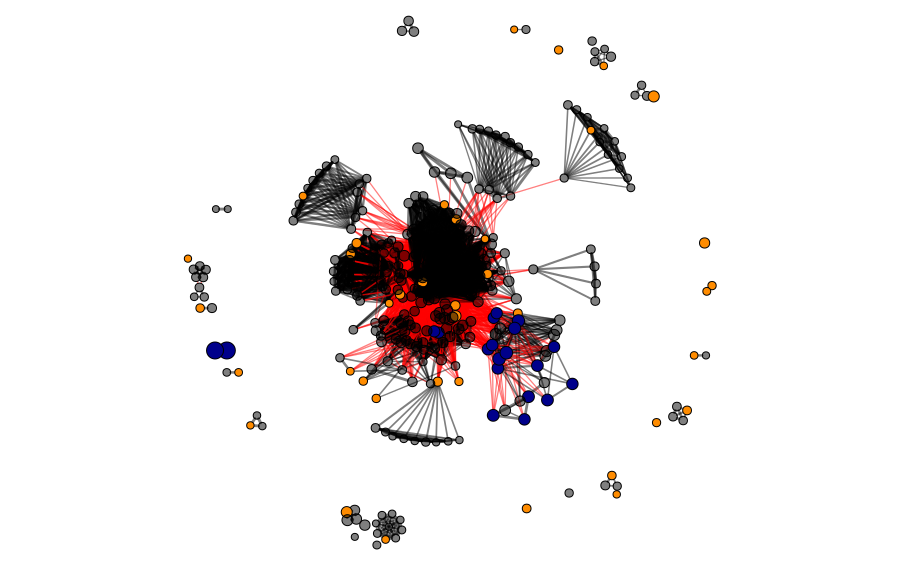
To show how good the sampling of the universe of candidate proteins was, we show the selected proteins in the universe. The blue nodes represent the candidates selected by homology/identity to the reference protein sequence, and the orange ones represent the proteins selected because they are CD-HIT cluster representatives. In this case, we ended with 56 selected sequences for the next steps. This demonstrates the importance of using both approaches, as it provides better sampling of different sites in the universe.
E6
The next plot shows the distribution of the protein identity to the reference enzyme. We can observe a distribution with proteins with identity values between 0.55 and 0.70, with only a few proteins having greater values.
When visualizing the adjacency matrix with a heatmap, we can observe the formation of a big cluster of proteins with high identity within the group and only a few sequences outside this big cluster.
The clusters formed by the CD-HIT were created with a threshold value of 0.7 and a word size of 5, resulting in 39 clusters. In the case of the correlation network analysis, the threshold for the cut was 0.25. The comparison of the CD-HIT clusters against the correlation network (StaticAdj) modules is shown in the next figure.
In the next figures, we can observe the clusters and modules formed by the two methods in the protein universe represented as a network, where each color represents a different cluster or module.
In the next figure, we show the selected proteins in the universe. The blue nodes represent candidates selected by homology/identity to the reference protein sequence, and the orange ones represent the proteins selected as CD-HIT cluster representatives. In total, 47 enzymes were selected for the next steps.
E9 & E10
Initially, we proposed that E9 could catalyze the cyclization of 5-aminopentanal to form 1-piperideine. However, a paper published this year suggested that this process occurs spontaneously without the need for enzymatic activity. As a result, we ceased our search for alternative enzymes for this specific reaction (Lv, et al., 2024).
On the other hand, the case of E10 was more complicated. The same paper (Lv, et al., 2024) remarked that this step is one of the key unsolved steps of the pathway, and no one knows which enzyme is involved. Our first proposal was a bacterial alternative that catalyzed a similar, but not identical, reaction. Therefore, since we were not sure about if that enzyme was even the best choice, our procedure consisted in reading papers to find other similar reactions in different organisms. After that, we performed BLAST to include the closer enzymes so we could cover many alternatives. In total, we included three distinct groups and their BLAST relatives. We used a reductive aminase from Aspergillus oryzae, galactose oxidase, and imine reductase from Fusarium graminearum. (Aleku, et al., 2017; Ford, et al., 2020).
References
- Aleku, G. A., et al. (2017). A reductive aminase from Aspergillus oryzae. Nature Chemistry, 9(10), 961-969.
- Edgar, R. C. (2004). MUSCLE: multiple sequence alignment with high accuracy and high throughput. Nucleic Acids Research, 32(5), 1792-1797.
- Ford, G. J., et al. (2020). Synthesis of protected 3-aminopiperidine and 3-aminoazepane derivatives using enzyme cascades. Chemical Communications, 56(57), 7949-7952.
- Fu, L., et al. (2012). CD-HIT: accelerated for clustering the next-generation sequencing data. Bioinformatics, 28(23), 3150-3152.
- Grant, B. J., et al. (2006). Bio3d: an R package for the comparative analysis of protein structures. Bioinformatics, 22(21), 2695-2696.
- Langfelder, P., & Horvath, S. (2008). WGCNA: an R package for weighted correlation network analysis. BMC Bioinformatics, 9, 1-13.
- Lv, Y., et al. (2024). Metabolome profiling and transcriptome analysis filling the early crucial missing steps of piperine biosynthesis in Piper nigrum L. The Plant Journal, 117(1), 107-120.